ANALYTICS BASED ON WOMEN
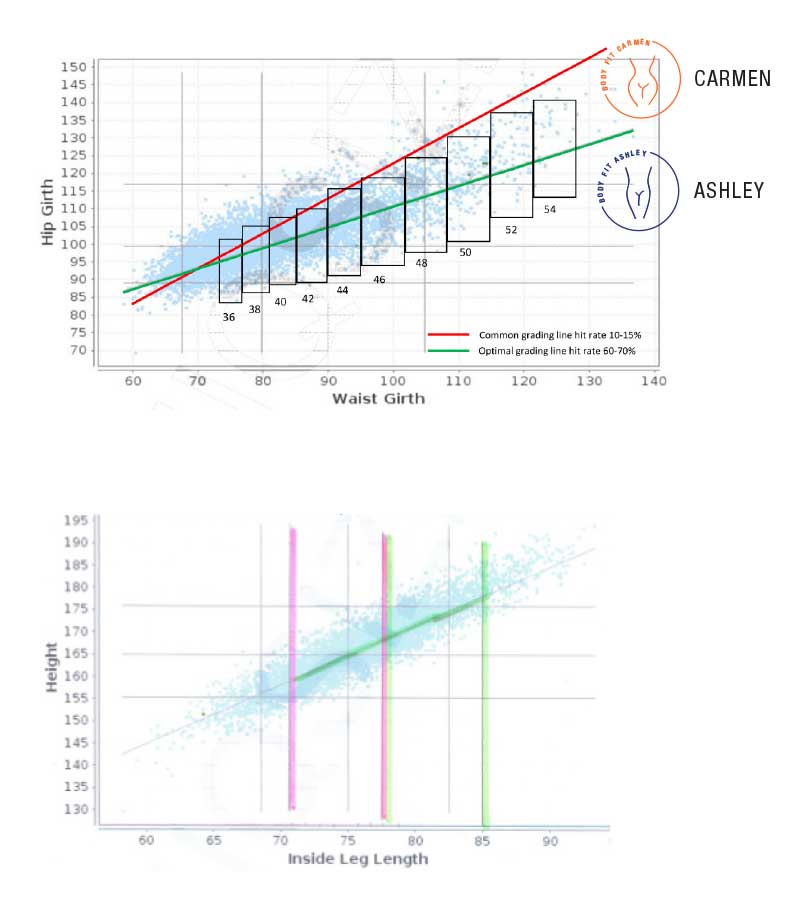
The regression pictured below shows the ratio between women’s waist and hip girth.
The blue spots represent the measurements done in 2009 of 6,500 women in Germany
between the ages 18-75.
The red slope states how the majority of clothing brands grade and hit the market.
The green slope states the optimal grading line for the market.